EIS 9: Graphing the Expansion of a Metal
This lesson is designed to teach you one of the most universally important skills in all of science, and many other industries: using spreadsheets. Spreadsheets, like expansion gaps and expansion joints, may not seem like the most exciting thing in the world, but they’re actually really convenient and make it super easy to calculate lots of things at once. Imagine being able to do 100, 1000, or 1 million math problems in just a few seconds! You’d have so much more spare time for doing other things that aren’t repetitive math problems, and that is really exciting.
Spreadsheets are pretty easy to use, but a lot of people can be confused by it at first. First step: You need to have access to a spreadsheet program. Microsoft Excel comes as part of the Microsoft Office package, so if you have Word and PowerPoint on your computer, you have Excel. If you use Pages (the Apple software), the spreadsheet program is called Numbers. If you use Google Drive, the program is called Sheets. If you don’t have any of these, you can set up a Google Drive account for free.
Spreadsheets are pretty easy to use, but a lot of people can be confused by it at first. First step: You need to have access to a spreadsheet program. Microsoft Excel comes as part of the Microsoft Office package, so if you have Word and PowerPoint on your computer, you have Excel. If you use Pages (the Apple software), the spreadsheet program is called Numbers. If you use Google Drive, the program is called Sheets. If you don’t have any of these, you can set up a Google Drive account for free.

|

|

|
Look for Microsoft Excel or Apple Numbers on your computer; or, if you prefer, go to sheets.google.com
Each of these programs has slightly different menus, but they all have essentially the same features and formulas. We won’t be using formulas today.
The first part of this lesson will be a simple exercise designed to teach you how to create a graph using a spreadsheet. It will also show you the general pattern for the expansion of a solid under heat. You will then create your own graph using data obtained from a home experiment.
Part 1: Creating a Graph with Excel
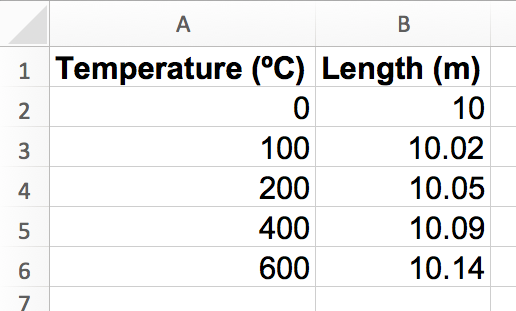
You will create a graph of the following data, which shows the change in length for an aluminum rod as heat is applied.
Temperature (ºC) |
Length (m) |
10 |
|
100 |
10.02 |
200 |
10.05 |
400 |
10.09 |
600 |
10.14 |
We are creating a scatter chart with a trendline. This means that the computer will plot each of the points (it will put the point on the proper part of the chart based on its x,y coordinates) and then find a line of best fit, which is a straight line that best represents all of the data, but might be a little off from any particular point. This is important because, whenever you are working with real data, each point might be a little bit off, so we mainly worry about averages. A trendline is basically an “average line”.
First, open your program. If you are using Excel or Numbers, click “blank workbook” if it asks. If you are using Google Drive, click NEW > Google Sheets in the left sidebar.
Then, enter the data exactly as you see it above. Depending on your program, you might be able to copy and paste the whole thing. The goal is to get each value into its own box, like this:
If you try to copy and paste all at once and it doesn’t look like this, you will need to enter the numbers by hand. Whenever you enter anything by hand, be sure to double check that they are exactly right. To enter a value, simply click on the box where you want to enter something and start typing. To exit the box, click enter (to go down) or tab (to go right). (You can also just click out if you are typing a simple value like we are now, but if you are typing a formula this won’t work and you will end up adding a bunch of stuff to your box). You can make the titles bold by selecting the box and clicking the bold button (B) in the Home tab (or control/command b).
You want to make a chart out of your data by selecting the data (simply click and hold your mouse button and drag it over the data you want to select), creating a basic scatter plot, fixing the titles and axis titles to make the graph pretty, and adding a trendline with an equation. The exact menu options for these will differ by program. The video links below will help you do this for your particular program, if you can’t figure it out on your own. If your program isn’t listed, try searching “scatter chart with trendline in [Your Program] [Year your program was released]” on YouTube or Google. You can also try searching the help menus of your program, or asking someone who uses the same program you do (such as an adult in your house) if they know how to do it.
Excel
Numbers
Google Sheets
(Note: if you can’t find the trendline option, you should be able to click and then right click the points on the graph and then select “Add Trendline” in pretty much any program, at which point you should see some sort of checkbox that says “Include equation”).
Be sure to include the following on your graph:
You do not need to include a legend, but you can if you want to. You can format your chart however you want as long as all of the things listed above are included.
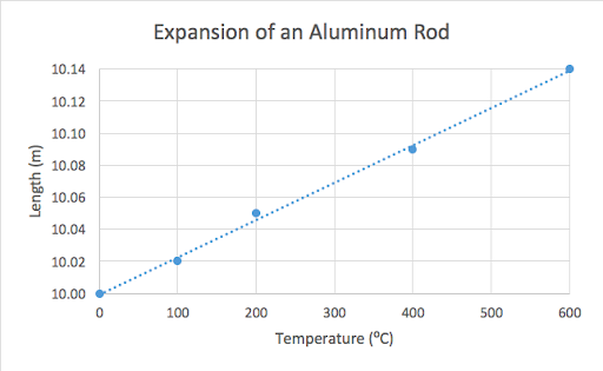
Your graph should look something like this:
You want to make a chart out of your data by selecting the data (simply click and hold your mouse button and drag it over the data you want to select), creating a basic scatter plot, fixing the titles and axis titles to make the graph pretty, and adding a trendline with an equation. The exact menu options for these will differ by program. The video links below will help you do this for your particular program, if you can’t figure it out on your own. If your program isn’t listed, try searching “scatter chart with trendline in [Your Program] [Year your program was released]” on YouTube or Google. You can also try searching the help menus of your program, or asking someone who uses the same program you do (such as an adult in your house) if they know how to do it.
Excel
Numbers
Google Sheets
(Note: if you can’t find the trendline option, you should be able to click and then right click the points on the graph and then select “Add Trendline” in pretty much any program, at which point you should see some sort of checkbox that says “Include equation”).
Be sure to include the following on your graph:
- A descriptive title, such as “Expansion of an Aluminum Rod” or “Change in Length of an Aluminum Rod with Increasing Temperature”
- Axis titles, including units. Don’t worry too much about making the degree sign (º) if you don’t already know how to do it (Mac users can use the keyboard shortcut alt/option 0). Temperature should be on the X (bottom) axis and Length should be on the Y (side/upward) axis.
- The trendline.
- The equation of the trendline.
You do not need to include a legend, but you can if you want to. You can format your chart however you want as long as all of the things listed above are included.
Your graph should look something like this:
Part 2: Measuring the Expansion of a Metal Rod
The goal of this experiment is to measure the expansion and contraction of a standard metal rod at room temperature, the freezing point of water (0 ºC), and the boiling point of water (100 ºC). You may use any 3 temperatures as long as you have a precise way of determining what they are. These three were chosen because they are the easiest to achieve in a normal household environment. As always when working around heat, use caution and be sure to get the permission or supervision of your relevant responsible adult.
Materials
- A metal rod of some kind. It is best if you know what type of metal it is. Something small like a large nail or entirely metal butter knife works best, rather than something larger like a curtain rod. (Tip: aluminum works best for this experiment)
- A ruler, measuring tape, or meter/yard stick.
- A boiling pot of water.
- A container of ice water. Make sure the container is sturdy and won’t melt under a moderate amount of heat.
- Oven mitts and tongs.
- A heat-resistant pad of some kind (like what you would put a hot pot onto after you took it off of the stove). If you don’t have anything like this, a cookie sheet will do. You just want something you can put the hot metal on while you measure it.
Procedure
1. Collect all of your materials. Make sure the water is boiling steadily and the ice water has had time to get cold. You want to get to the point that any ice you add doesn’t melt, and still have ice in the container.
2. Measure the metal rod from end to end, long ways. Record this number.
3. Heat the metal rod by dropping it into the boiling pot of water. It should only take a couple of minutes to heat up, as long as the water is boiling. Be careful whenever you are using heat.
4. Put on your oven mitts, and using the tongs, remove the metal rod from the boiling pot of water. Place it onto the heat-resistant pad and quickly (but carefully - you do not want to burn yourself) measure the length of the rod. Record this value.
5. Give the metal rod a few minutes to cool off enough that you can pick it up without tongs.
6. Place the metal rod in the ice water. Be sure it is still icy.
7. Check on the metal rod every few minutes until it is as cold as the water. This should be about 5 minutes if the rod was properly cooled before putting it into the water.
8. Once cool, remove the rod and measure it again. Record this value.
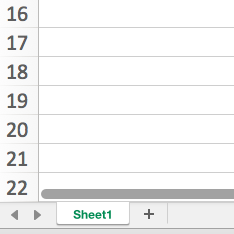
9. Create a graph of your data in Excel, just as you did above. You want this to be on a second sheet in the same workbook. Add a new sheet using the plus button next to the current sheet on the bottom of the workbook, as shown below.
2. Measure the metal rod from end to end, long ways. Record this number.
3. Heat the metal rod by dropping it into the boiling pot of water. It should only take a couple of minutes to heat up, as long as the water is boiling. Be careful whenever you are using heat.
4. Put on your oven mitts, and using the tongs, remove the metal rod from the boiling pot of water. Place it onto the heat-resistant pad and quickly (but carefully - you do not want to burn yourself) measure the length of the rod. Record this value.
5. Give the metal rod a few minutes to cool off enough that you can pick it up without tongs.
6. Place the metal rod in the ice water. Be sure it is still icy.
7. Check on the metal rod every few minutes until it is as cold as the water. This should be about 5 minutes if the rod was properly cooled before putting it into the water.
8. Once cool, remove the rod and measure it again. Record this value.
9. Create a graph of your data in Excel, just as you did above. You want this to be on a second sheet in the same workbook. Add a new sheet using the plus button next to the current sheet on the bottom of the workbook, as shown below.
Be sure that you have the independent variable on the X-axis (bottom) and the dependent variable on the Y-axis (upwards). The independent variable is the one we change experimentally. The dependent variable is the one you measure as the result of your experiment.
The temperature of ice water is 0 ºC. To find room temperature, look up the temperature of your house on your thermostat and convert this to Celsius if necessary. If you cannot find the temperature, assume 20 ºC. This is the room temperature value. The temperature of boiling water is 100 ºC.
The temperature of ice water is 0 ºC. To find room temperature, look up the temperature of your house on your thermostat and convert this to Celsius if necessary. If you cannot find the temperature, assume 20 ºC. This is the room temperature value. The temperature of boiling water is 100 ºC.
Answer Key
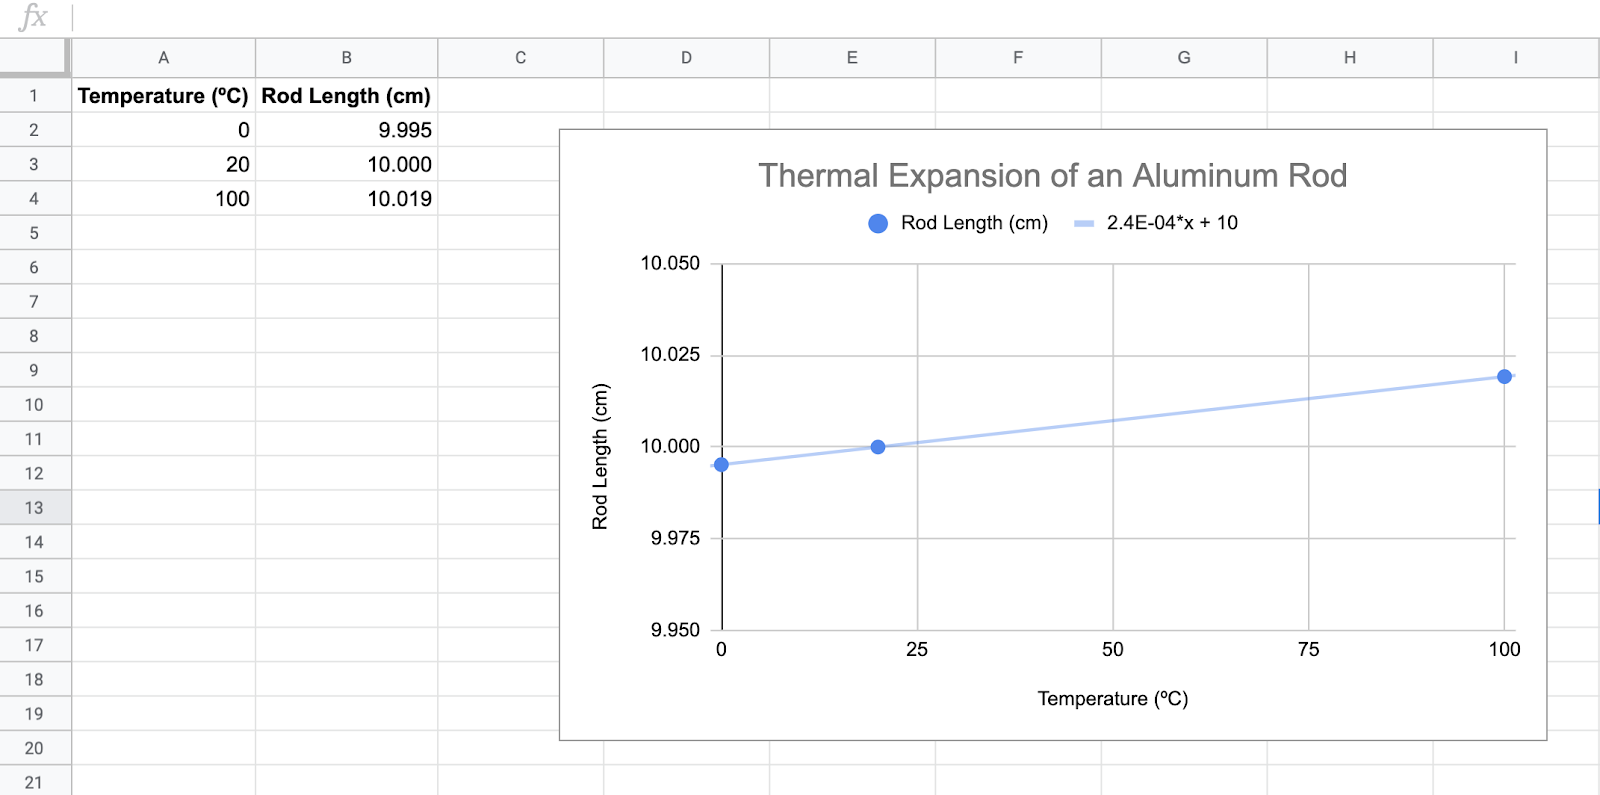
Your table and graph should look something like this:
Bonus Activity: Bridges
Want to put your engineering skills to the test? Try building a bridge out of no more than 200 toothpicks. Try to make it structurally sound, so that things like earthquakes, or a little sibling shaking it around, don’t break it. Test its ability to bear weight (coins work well for testing its weight tolerance). Be sure to include features that would allow it to withstand changes in temperature, if this were a real bridge. Check out this video for reference if you need!
If you come up with a bridge you love, we want to see it! If you have an Instagram account and the permission of your relevant responsible adult, share with us at @eons_learning, #BridgesEons